Gilda's Club Twin Cities Data Collection and Reorganization
I worked with a team of designers to improve the data collection process for a non-profit called, Gilda’s Club that provides support, resources, and free programs for those living with and affected by cancer. By improving their data collection and synthesis process, they will be able to spend less time manually gathering data and instead have more time to spend on the things that make Gilda’s Club so incredible.
Methods Used
Comparative Audit - Flexible Modeling - Deep Dive - Card Sorting
Tools Used
Sketch - Power BI
DIVING IN
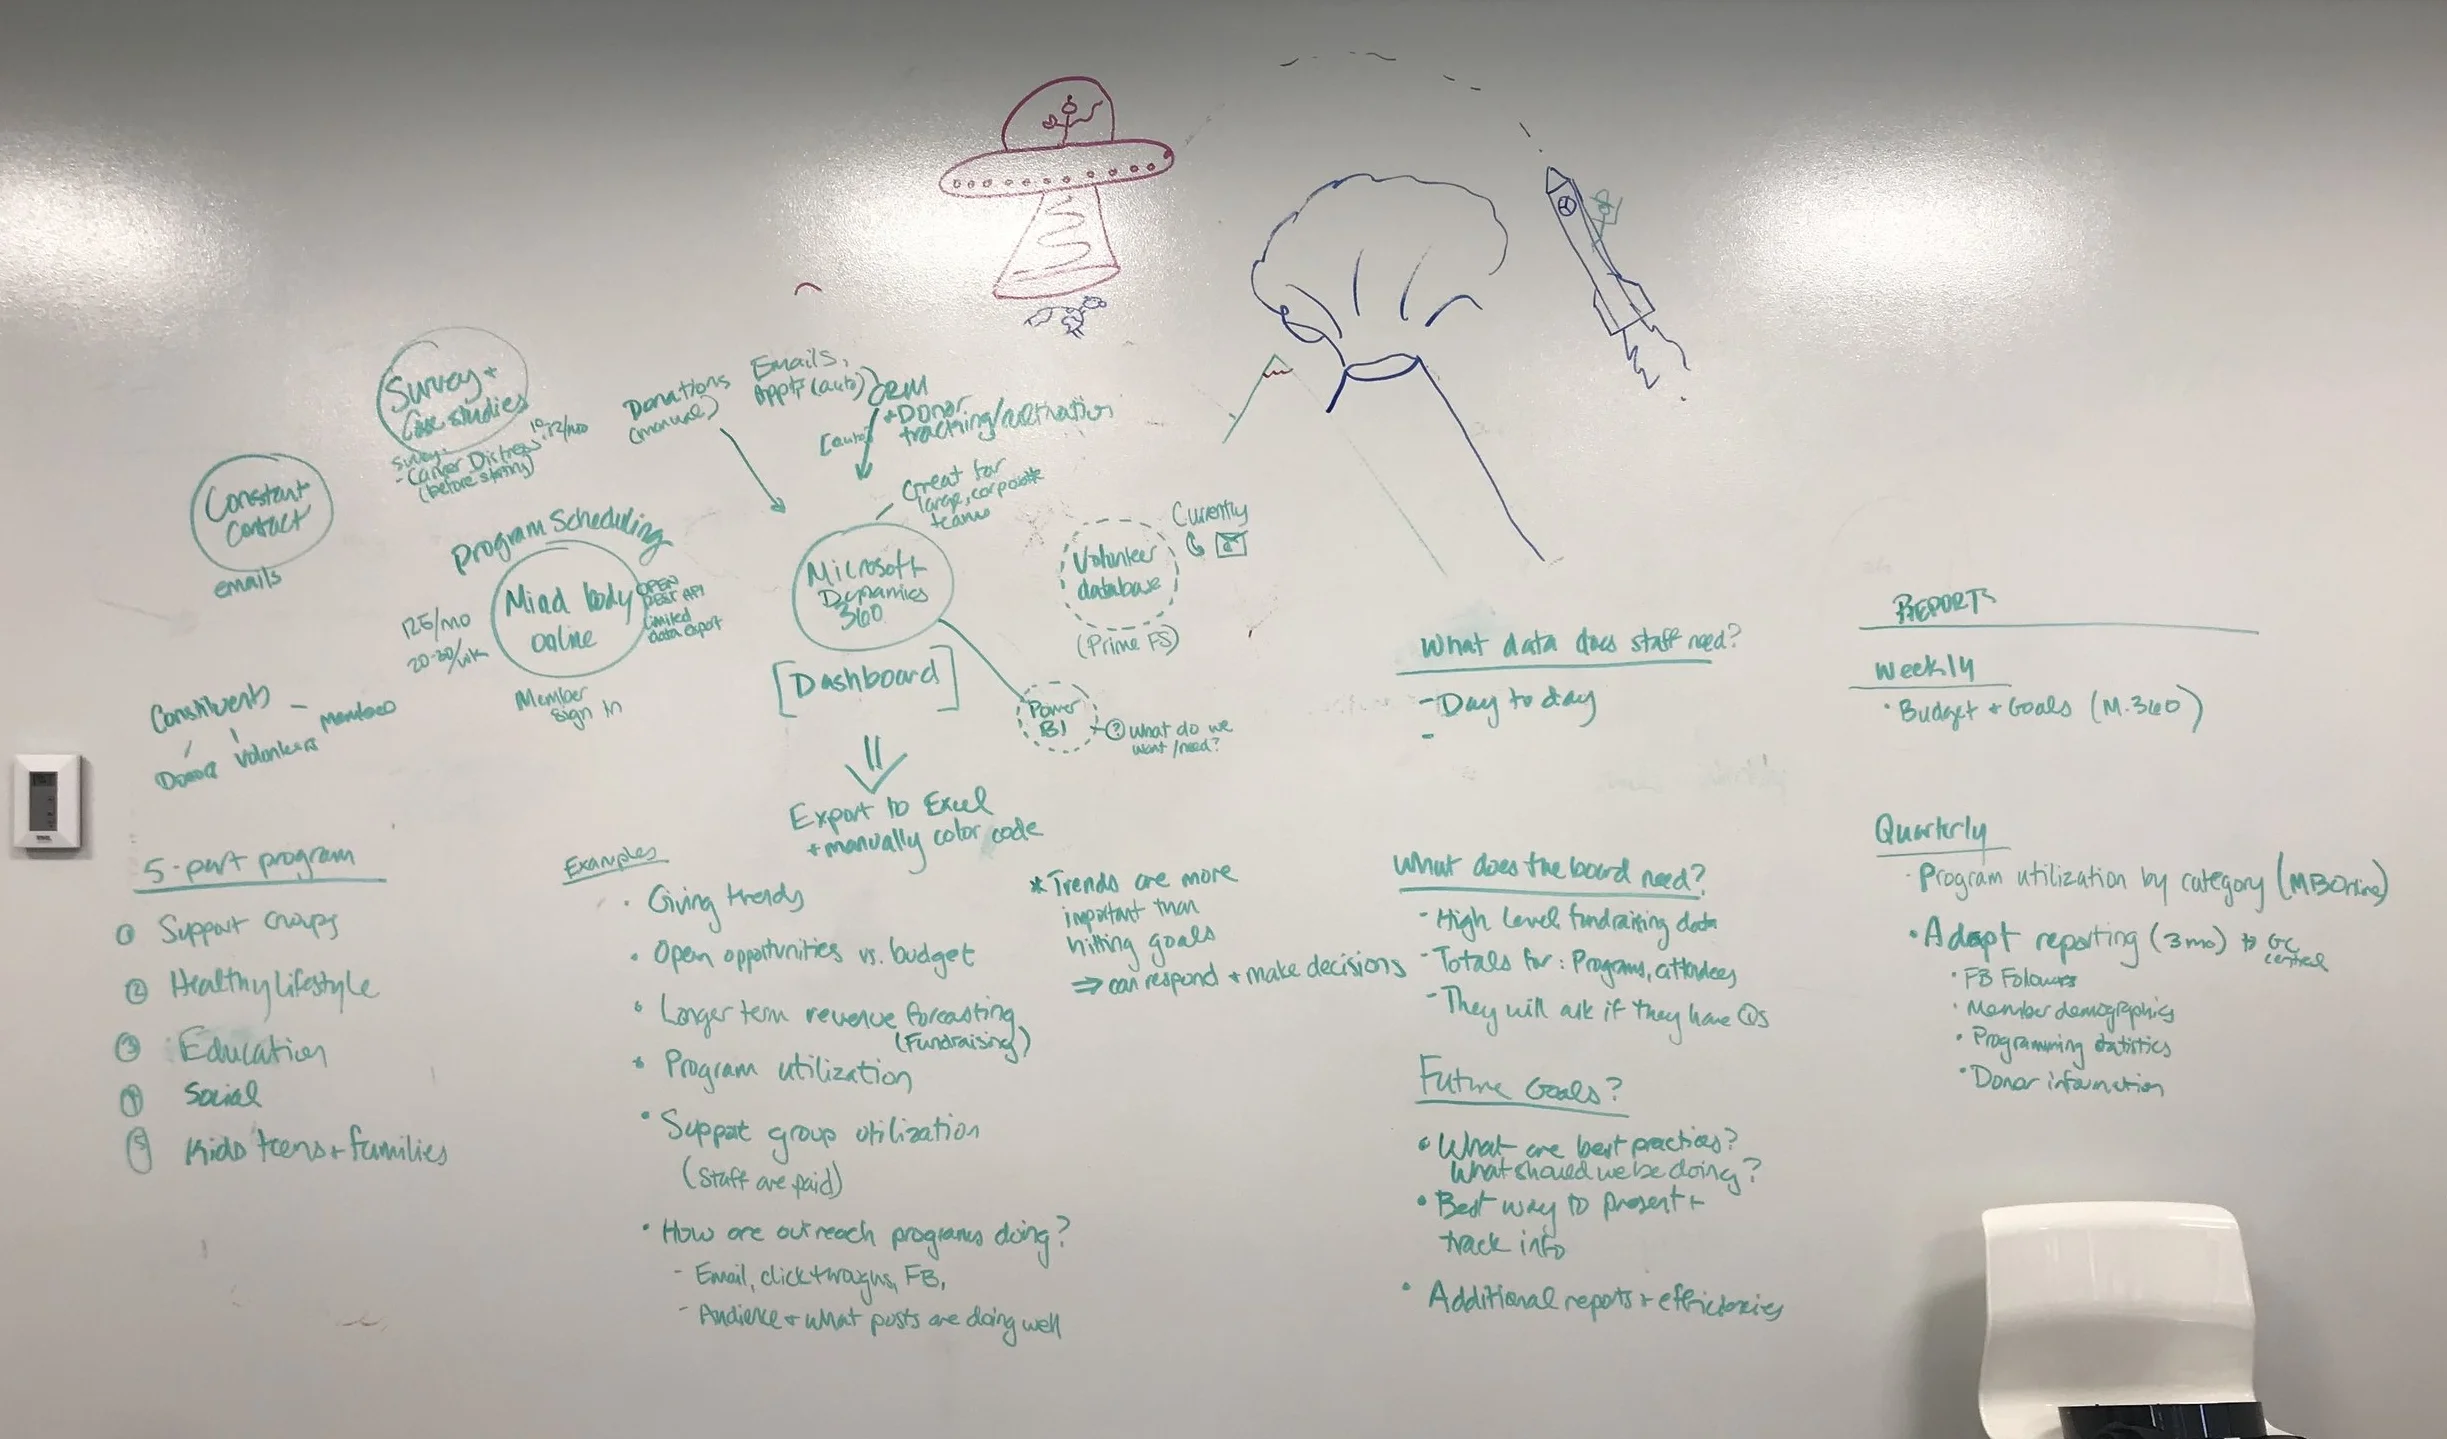
We kicked off this project with a meeting with Gilda’s Club’s Development and Stewardship Manager, Ryan. He walked us through all of the places they collect data from and the different ways they store it, manipulate it, and use it to inform both staff members and the board. Gilda’s Club had data that needed to be pulled together from a lot of different places and displayed in many different reports. Ryan was spending a a lot more time than he would have liked collecting and organizing data, especially since it was not supposed to be a large part of his job. The team left the meeting ready to dive deep into the current process and finding a solution.
Below is a peek into my sketchbook, which for this project was a lot of note taking and trying to visualize how the data was being collected and manipulated.
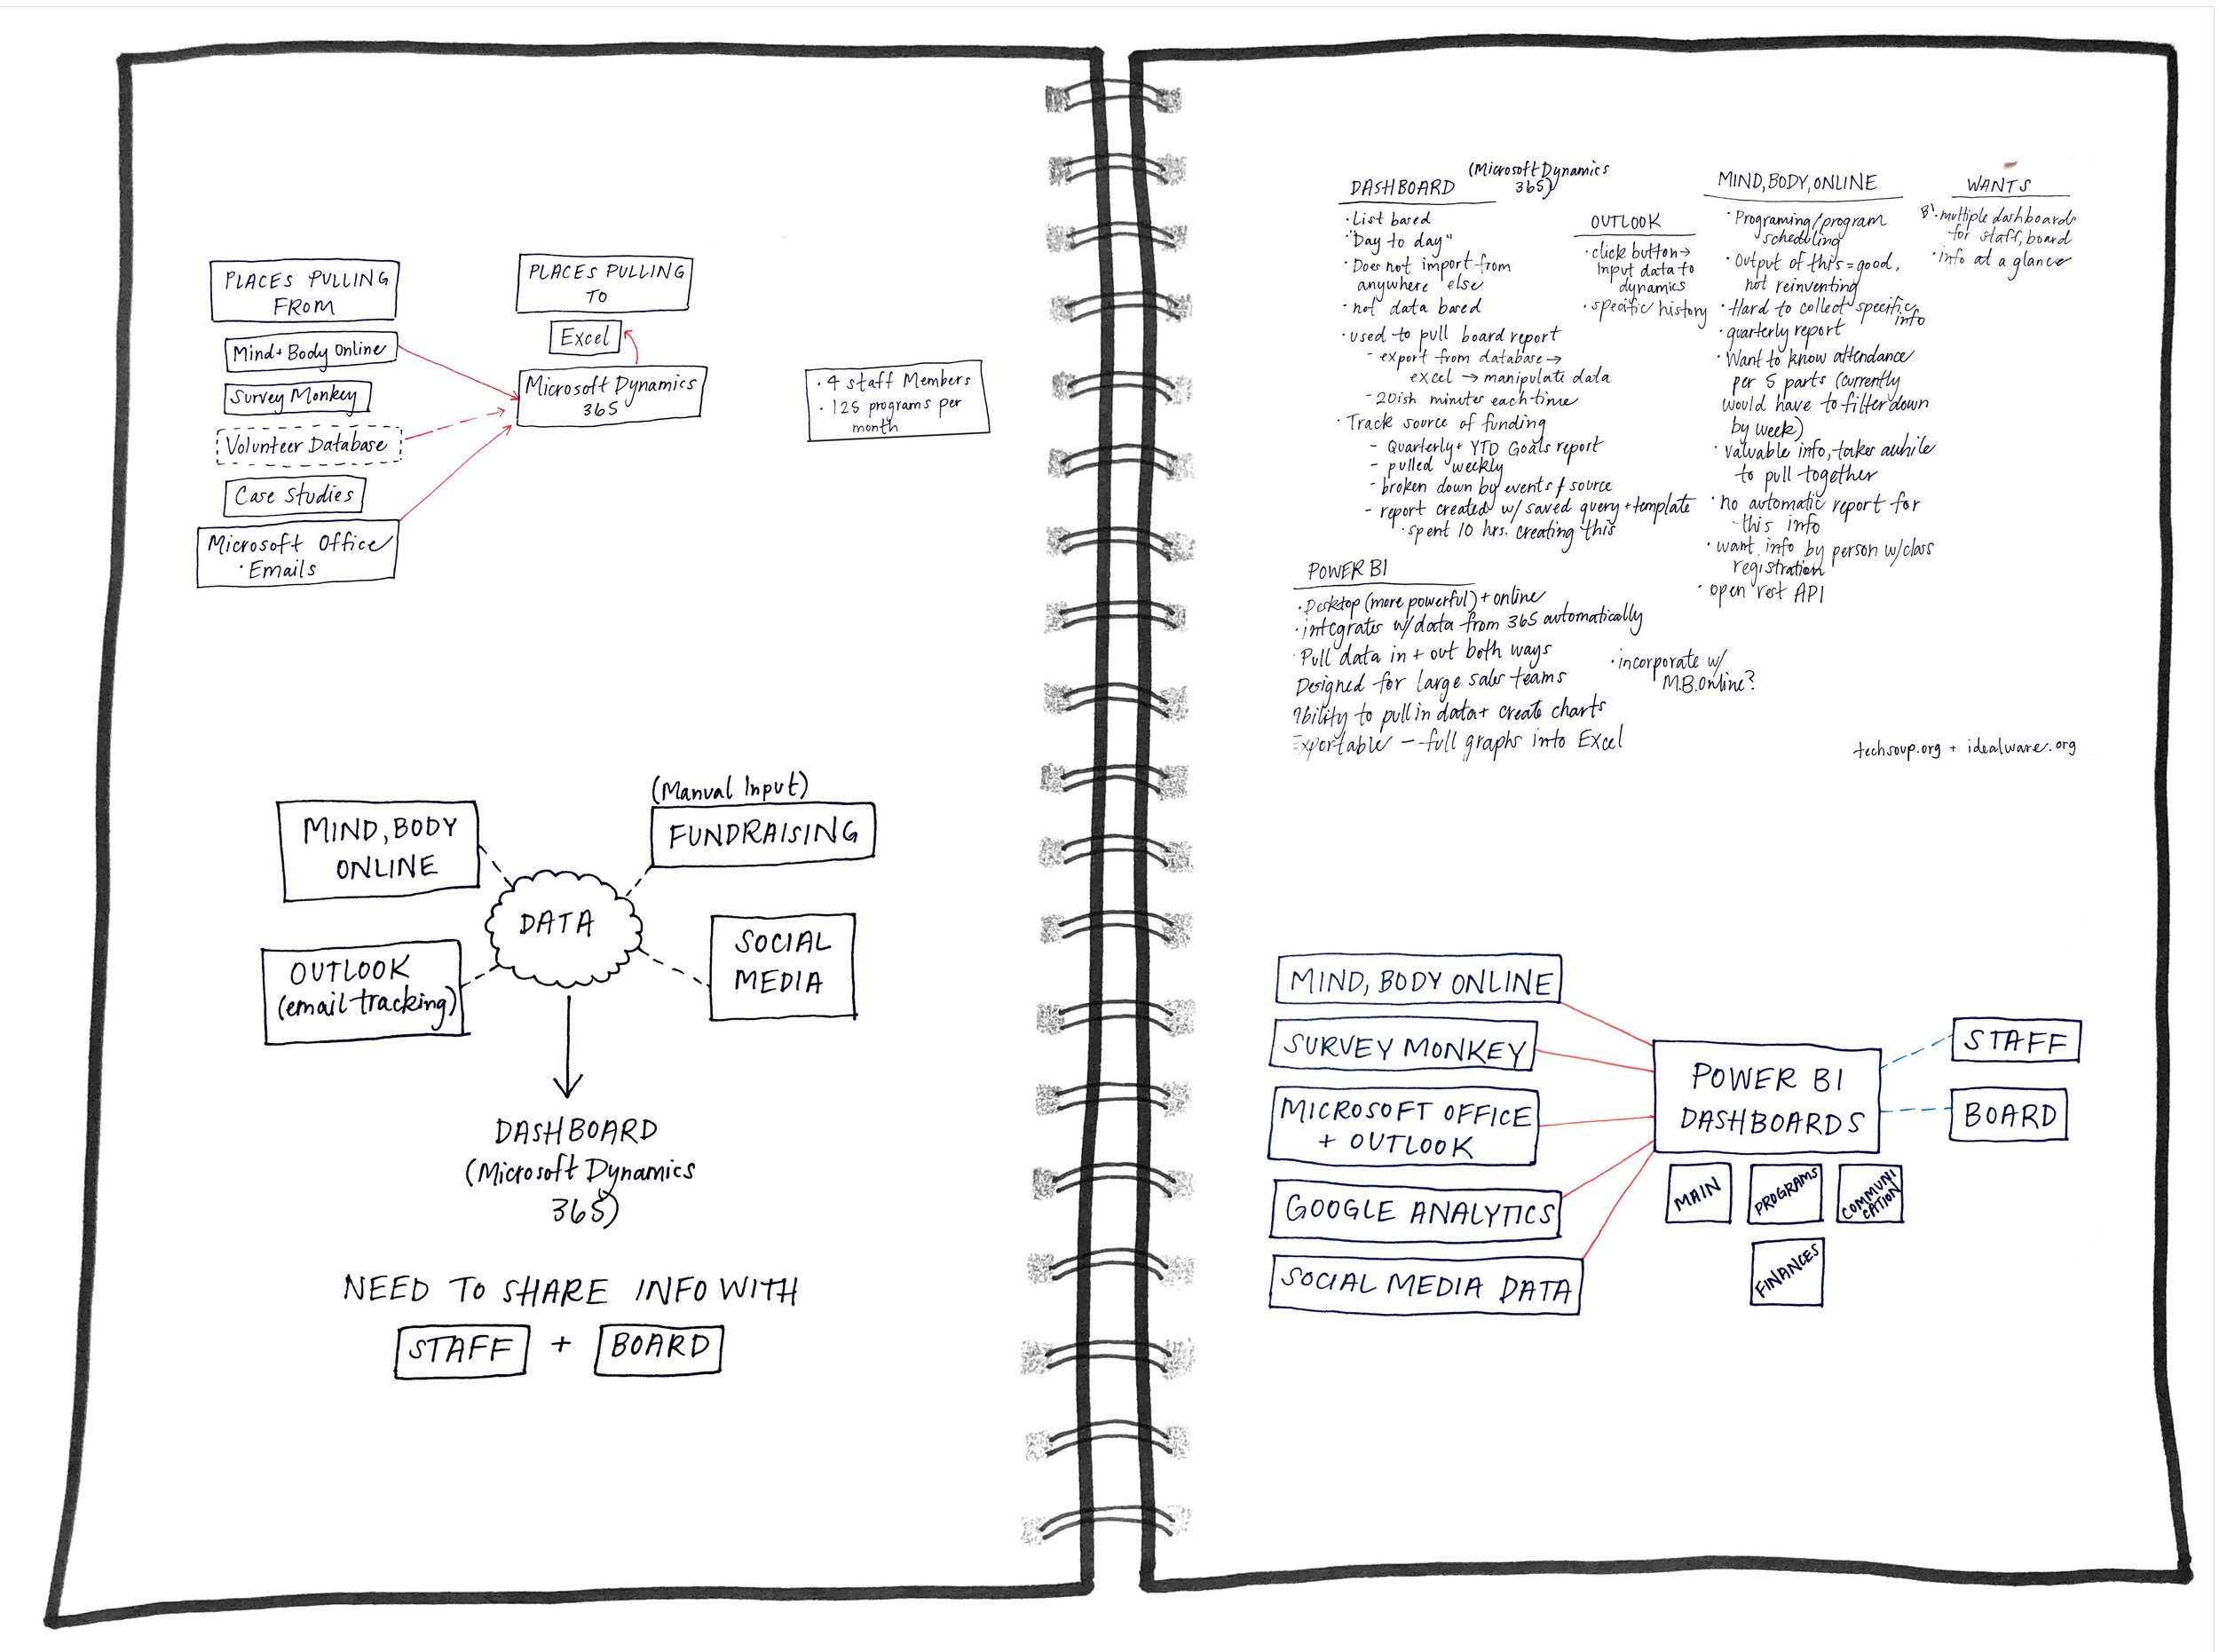
In the meeting that took place, our client had mentioned that Microsoft Power BI was a program they had access to, but that they were unfamiliar with it. After looking into other business intelligence programs we realized that Power BI could do everything that the Gilda’s Club team needed. After we were granted access to their data we set about forming what we thought would be the most meaningful relationships between data sets, to create graphs and charts of useful information.
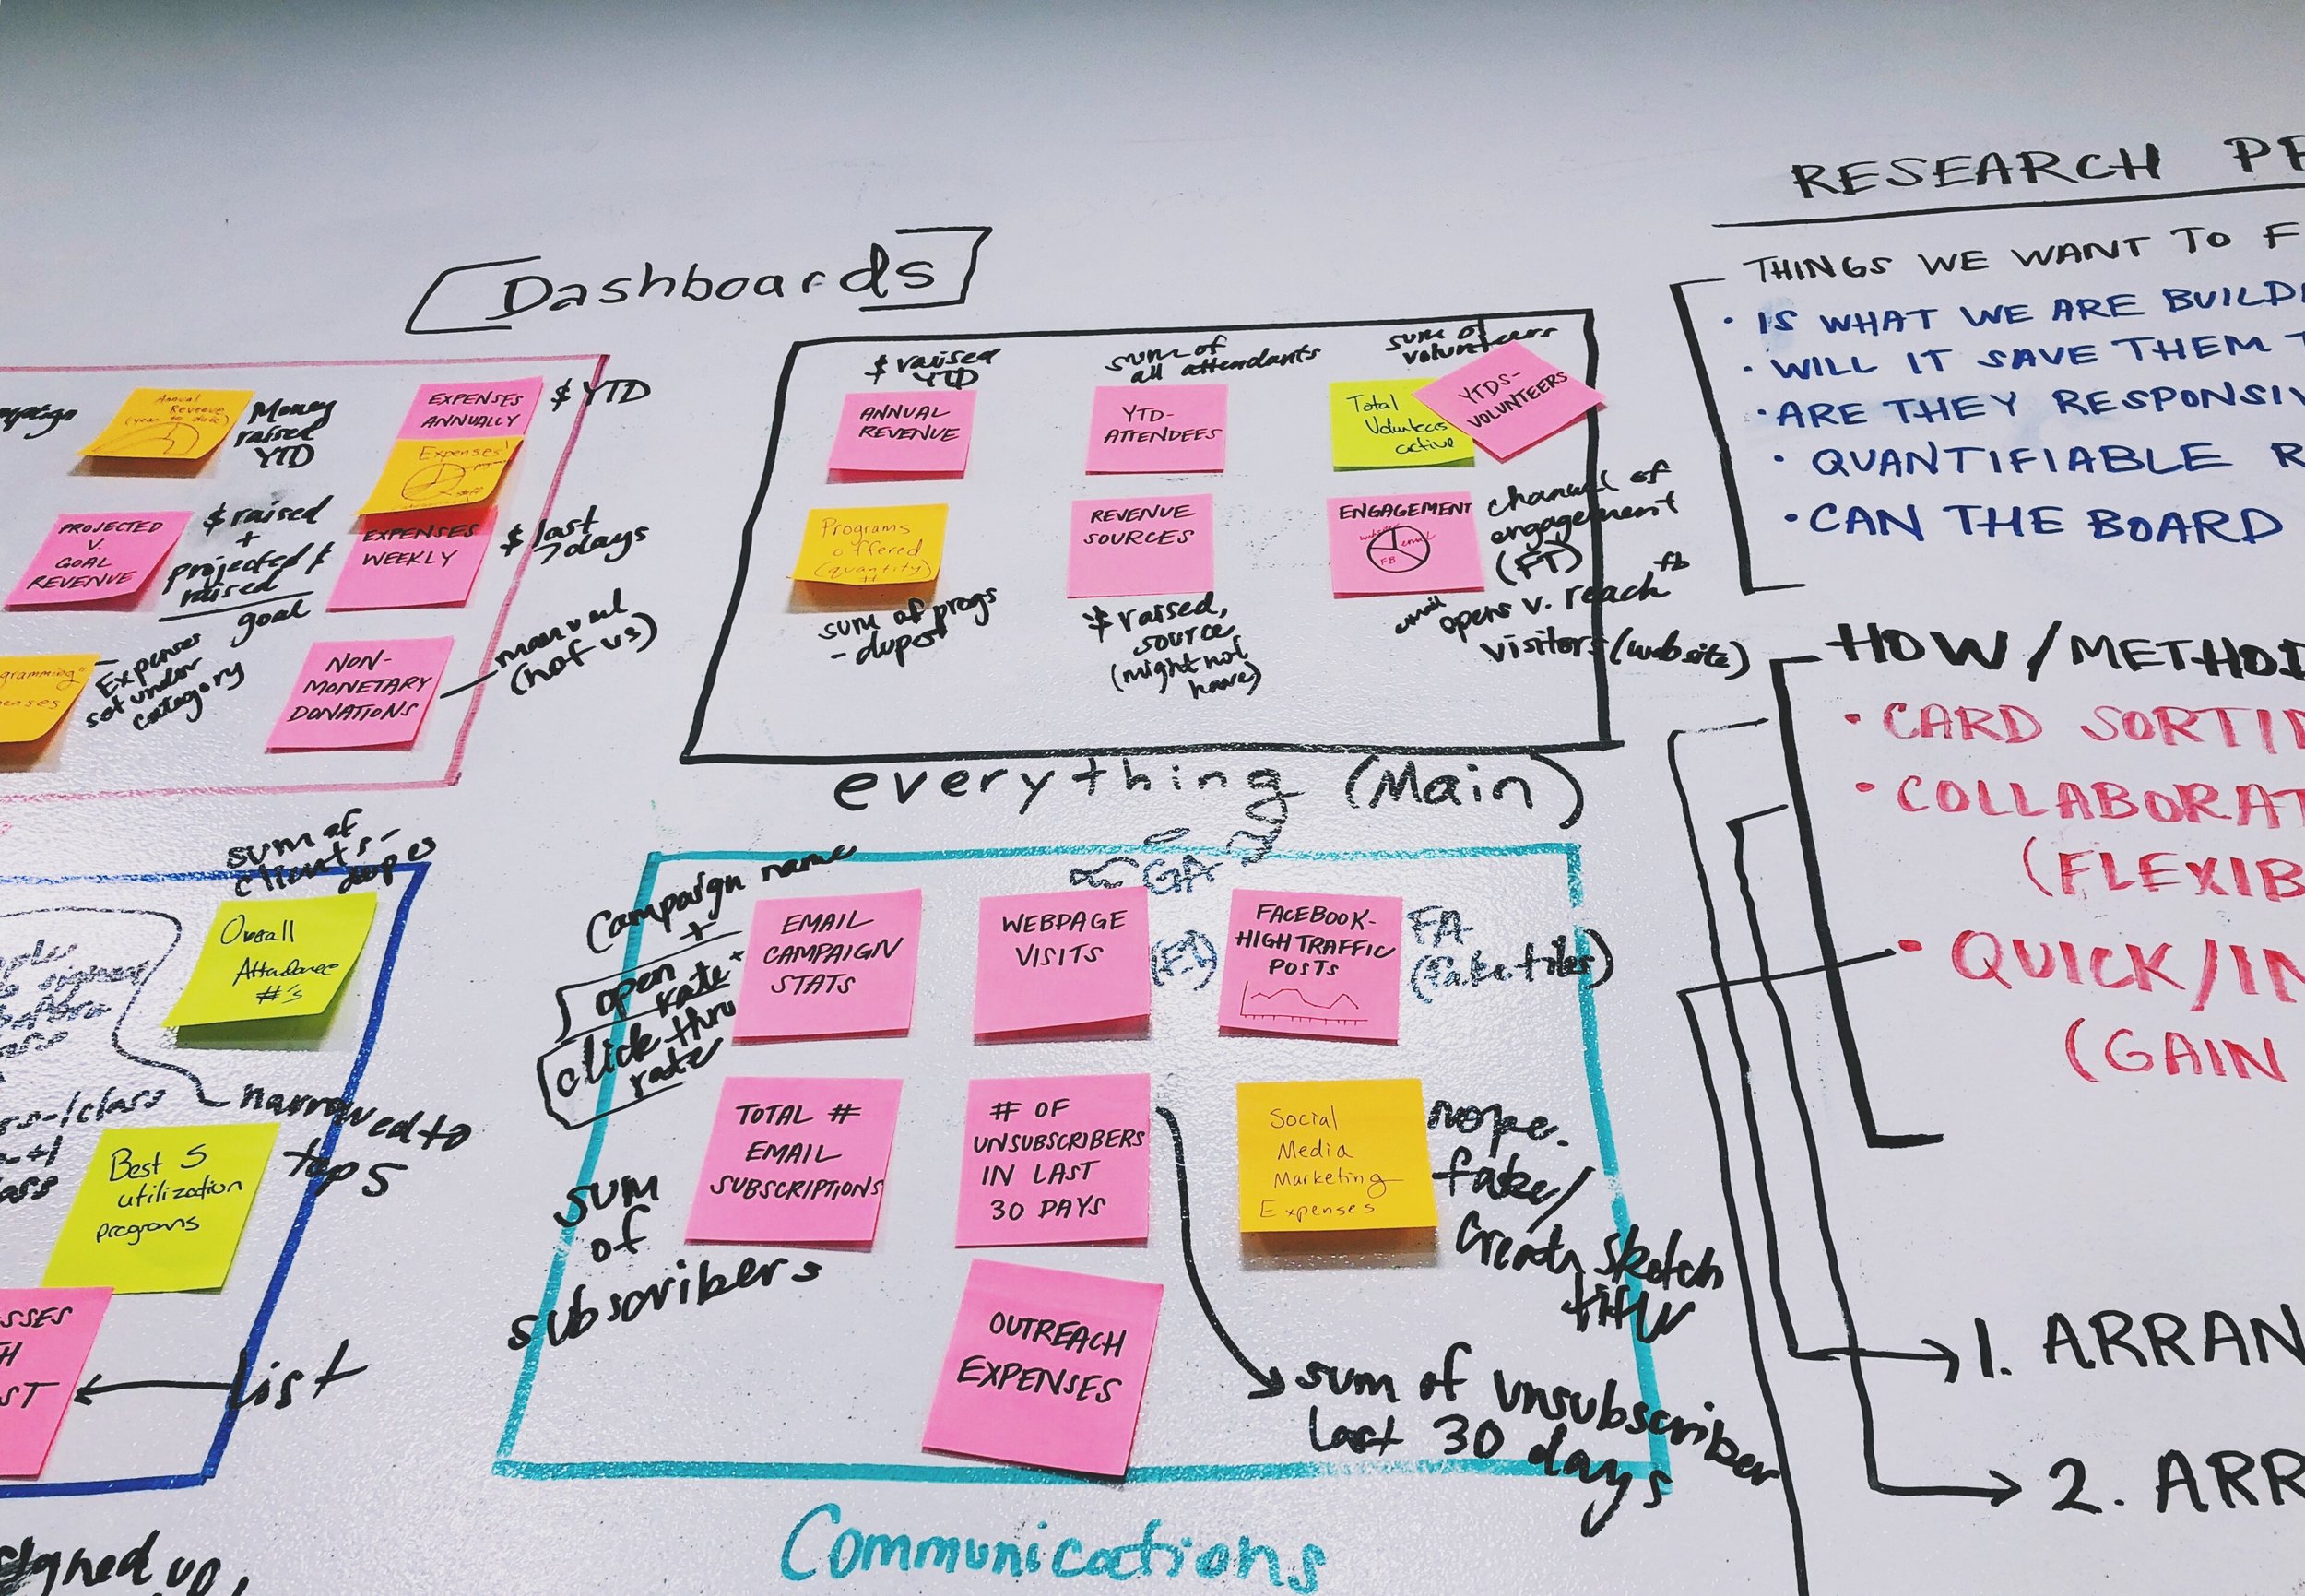
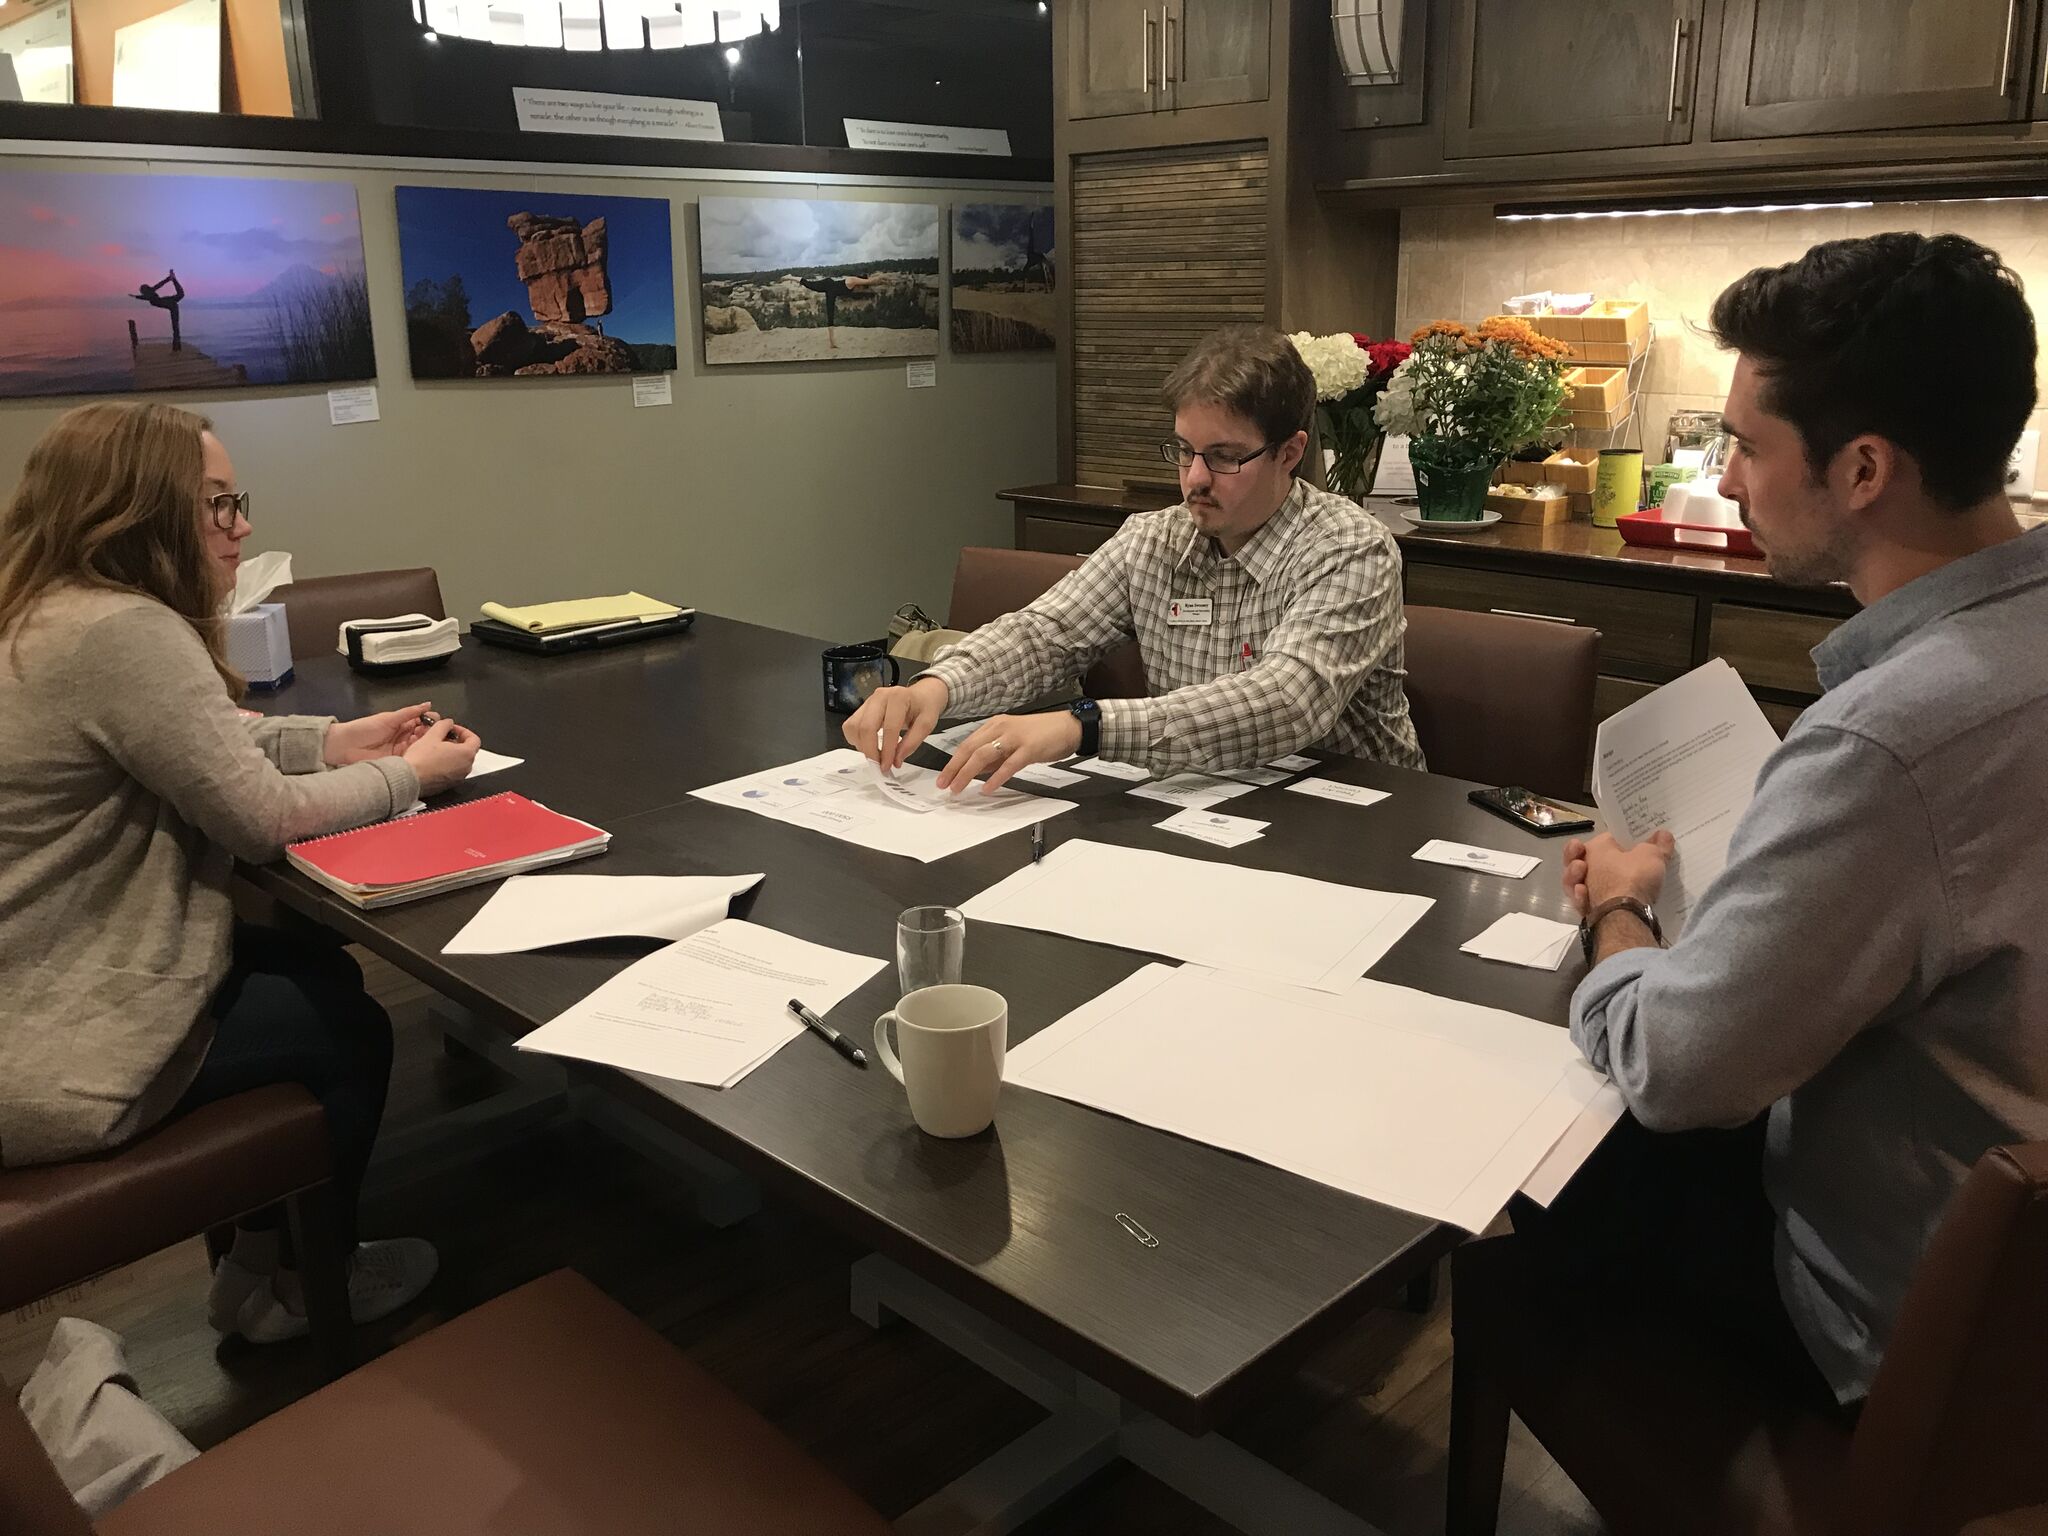
After committing to using Power BI we wanted to create separate dashboards for different areas that the Gilda’s team needed information on. We broke it down into Programming, Fundraising, and Communications. We thought that it would be most beneficial to build these with the Gilda’s team instead of for them, so we set up a card sorting activity for Ryan so he could place each small set of data where he saw most fit and sorted out which ones would be most useful for him and the rest of his team.
BRINGING IT ALL TOGETHER
We left the meeting ready to put the arrangements that Ryan had made into action. After rearranging the paper dashboard we had created we got into the nitty gritty of how to create the data relationships.
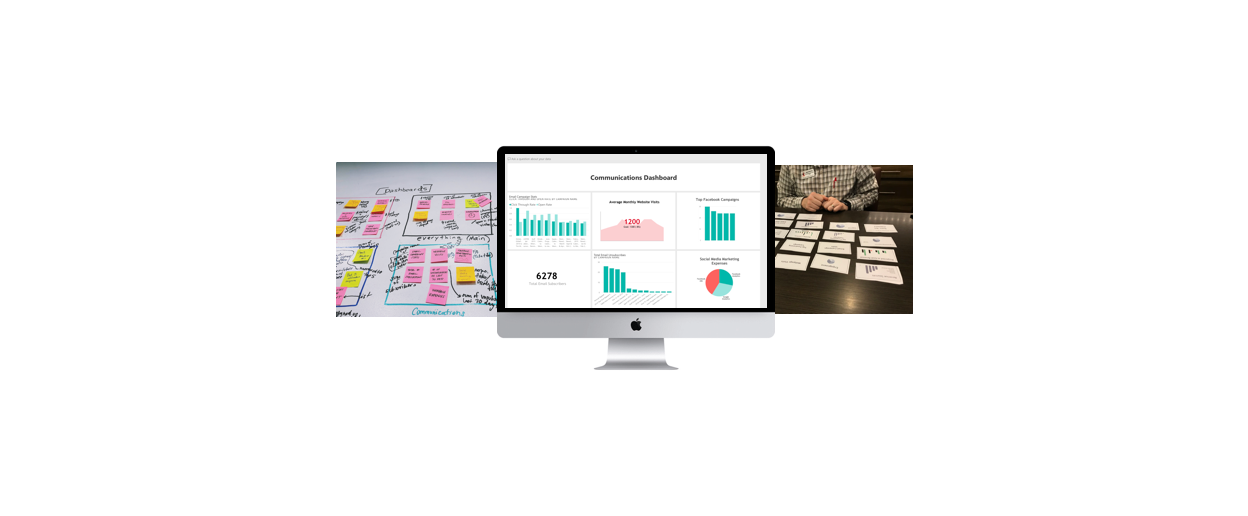
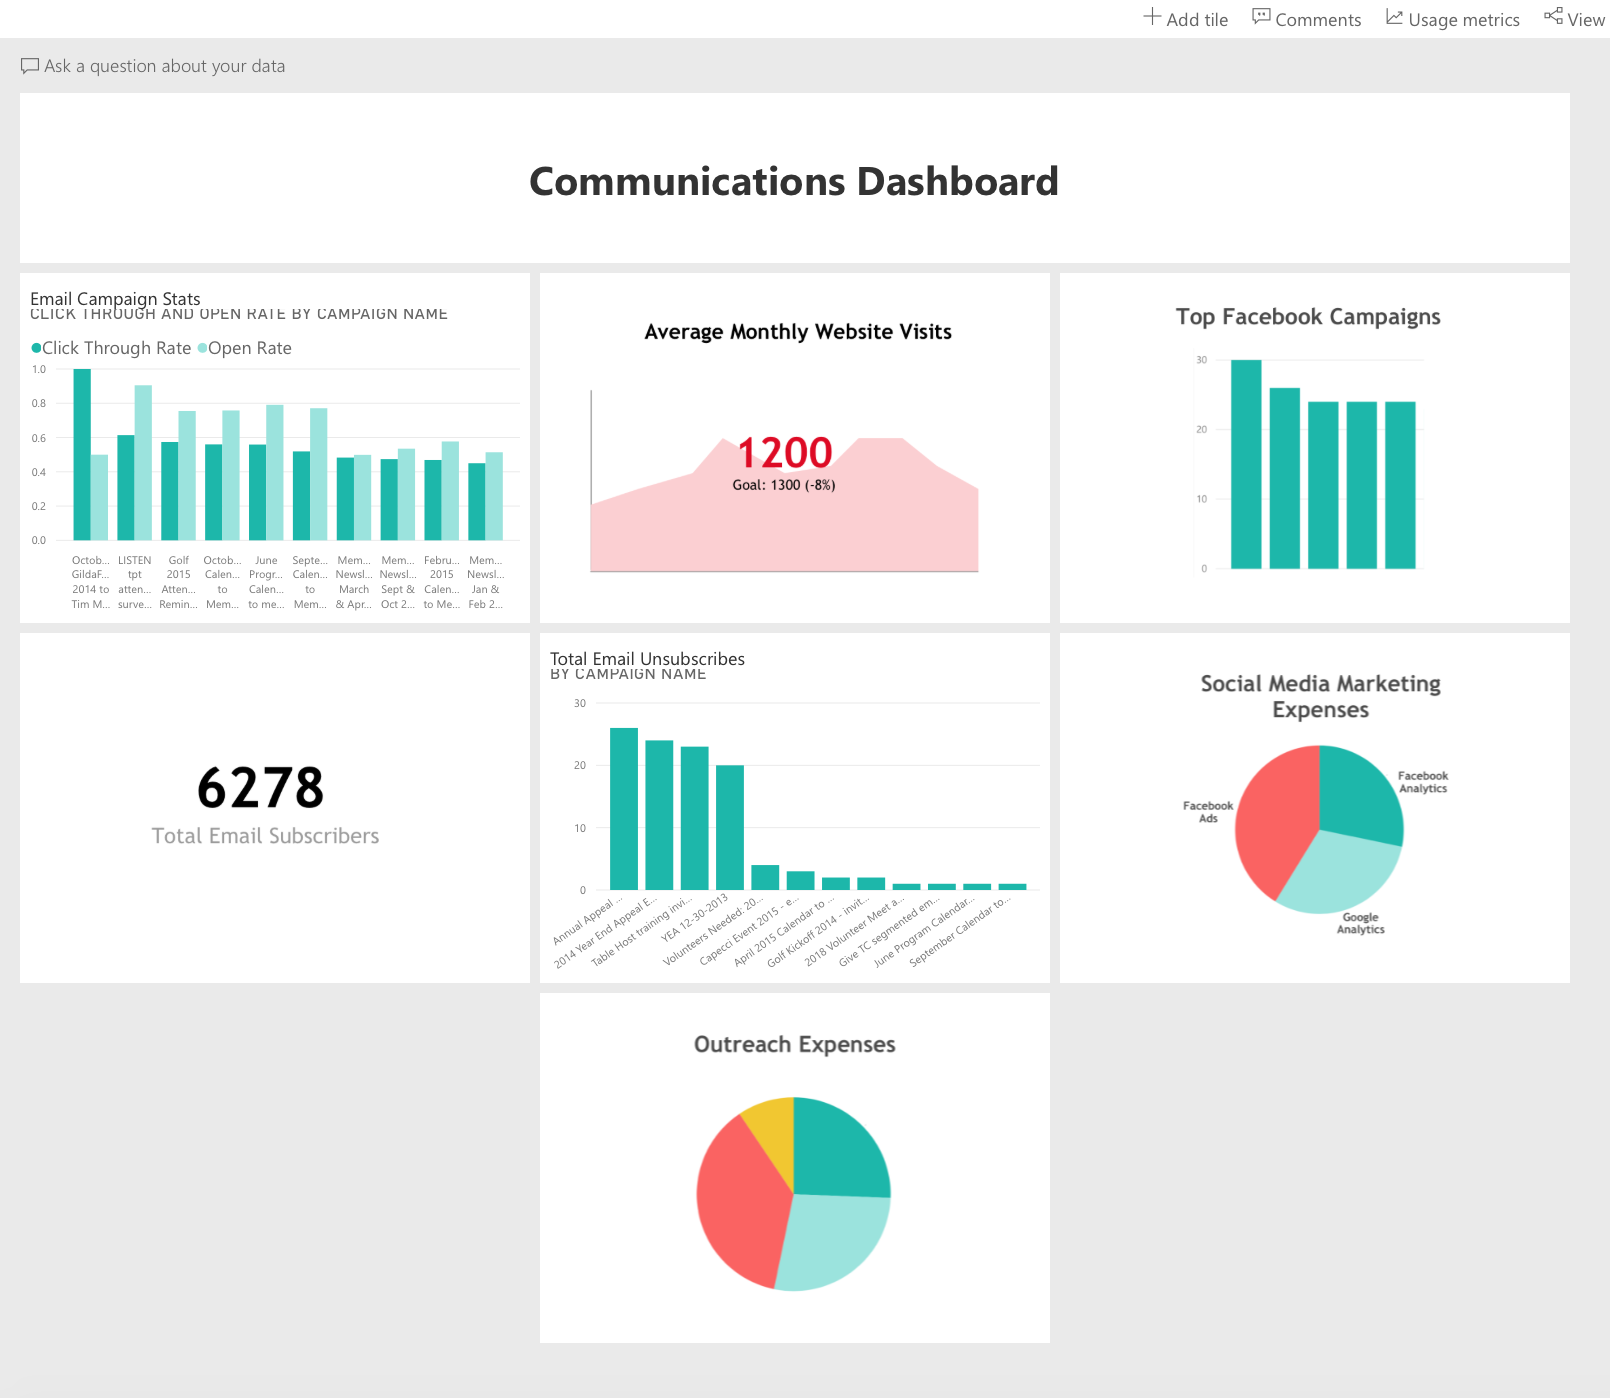
Below is an example of one of the dashboards that was created. We set out to arrange these data “snapshots” in a way that would be informative, easy to read, and useful for the Gilda’s Club team. For example, knowing which Facebook posts or email campaigns were getting the most attention would allow them to create more successful posts and email campaigns down the line.
WRAPPING UP
Overall, getting the chance to arrange a large amount of data was a really exciting opportunity. Initially I felt a little apprehensive since I’m normally not a numbers person. After breaking it down and remembering that the goal wasn’t about the numbers, and that it was about making this process easier for the people who use the numbers, it ended up being an incredibly rewarding project to work on.